Charts
A Chart step turns the results of earlier steps into charts. It does not query a database. It runs JavaScript, like a JavaScript step, and returns chart descriptions for Apache ECharts instead of data.
Add a chart step
Open the job in the editor.
Choose Chart in Step type and click Add step. The new step starts with the Line over time sample code.
To start from another sample, pick one in Template:
- Line over time
- Bars by category
- Share pie
- Key number
- Several charts
If you already changed the code, QueryLane asks before it replaces it with the template.
Replace the sample rows with the result of an earlier step. Tokens such as
${step_id}and${variable}become JSON values, the same as in JavaScript steps.
Each template begins with a comment that shows the line to change:
const rows = ${step_orders_by_day};
return [{
  title: 'Orders by day',
  option: {
    tooltip: { trigger: 'axis' },
    dataset: { source: rows },
    xAxis: { type: 'category' },
    yAxis: { type: 'value' },
    series: [{ type: 'line', encode: { x: 'day', y: 'orders' } }],
  },
}];
What the code returns
The code can return:
- an ECharts option object;
- an object
{ title, option, height }; - an array of either, to draw several charts from one step.
height is in pixels, from 120 to 1200. Without it a chart is 320 pixels high. To show a single number, use the Key number template: a chart with only a large title and a short height.
The result must be plain JSON, so a few ECharts features work differently:
- Functions are rejected. Use ECharts string templates instead, for example
formatter: '{b}: {c}'oraxisLabel: { formatter: '{value} ms' }. - Tooltips show plain text. Use
\nfor line breaks instead of HTML. - Images work only as
data:image/URIs. Links to remote images are rejected. - One step can return at most 24 charts and 5 MB of chart options.
Aggregate large tables in SQL or in a JavaScript step before the chart step. A chart of a million points is slow to draw and hard to read.
Chart steps cannot have result checks.
See charts after a run
When a run has charts, its entry in Execution history gets two tabs:
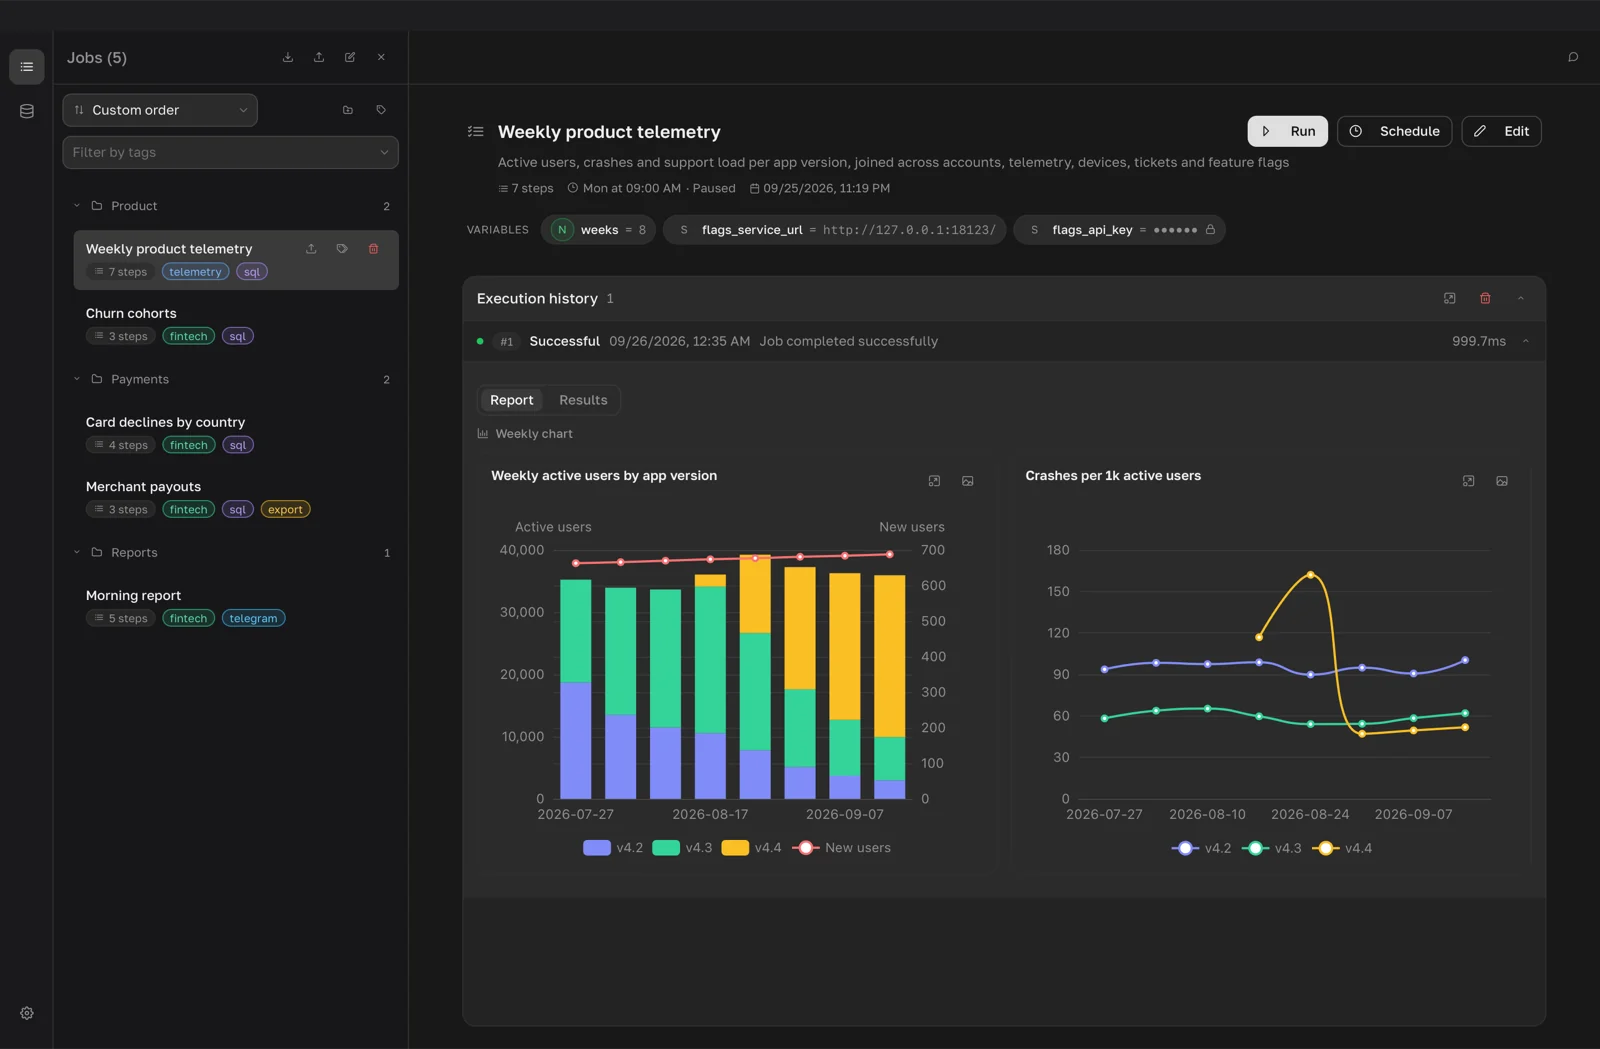
- Report shows every chart of the run, grouped by chart step in the order of the job's steps.
- Results shows the step list and data as for any other run.
The run opens on Report when the job's last step is a chart step, and on Results otherwise. Runs are described in Runs and artifacts.
The result of a single chart step also opens as charts. Its title shows the number of charts, for example Charts: 3, and the JSON view shows the returned options.
Charts follow the light or dark theme of the app.
Full screen and saving
Each chart has two buttons in its corner:
- Full screen opens the chart in a large window. Close it with the cross in the header.
- Save image offers PNG image or SVG vector image. QueryLane asks where to save the file and suggests a name made of the job name and the chart title.
PNG files are saved at double resolution with the chart background. If QueryLane cannot draw a chart, the chart shows Could not draw the chart with the ECharts error.
Charts and AI agents
An agent connected over MCP can render a chart from a finished run with querylane_chart_render and look at the image before it proposes the step.